
Secular and Liberal Ideology and LGBT Attitudes: The Results of Azzam Muhammadi Rizqun Karima's 2023 UI Study Explained
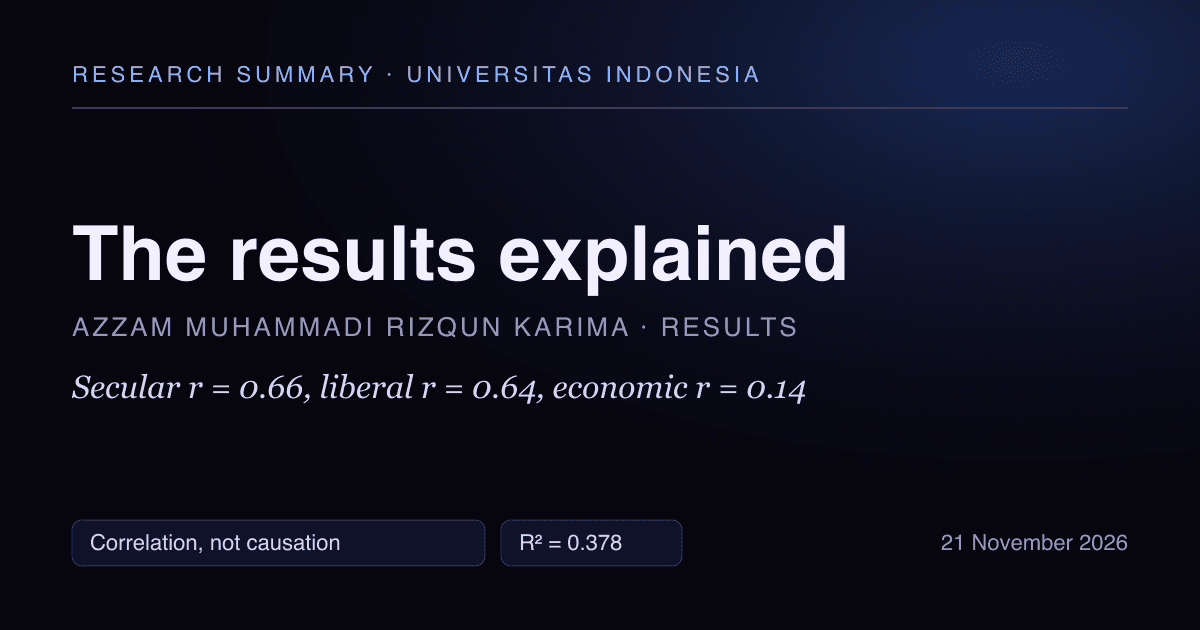
This post summarises Azzam Muhammadi Rizqun Karima's 2023 study at Universitas Indonesia (UI) as described in an evaluation report dated 12 May 2026. Every figure comes from that report; I have not re-run the analysis. It is a plain-language summary, not a peer-reviewed paper. The study measures students' attitudes; it says nothing about the author's own views.
Other posts in this series: the researcher profile, the key findings, the three-dimensional ideology framework, the survey method and the proposed research agenda.
This post walks through the numbers in the 2023 study by Azzam Muhammadi Rizqun Karima: what each one is, what it shows and what it does not.
How to read r and R²
- r is a correlation between two things, here a student's score on one ideology dimension and their attitude score. It runs from -1 to 1. Closer to 1 means the two rise together.
- R² is the share of the differences in attitude scores that the model accounts for. R² = 0.378 means about 38%.
The three correlations
- Secular–religious: r = 0.66. Students with more secular orientations held more positive attitudes.
- Liberal–conservative: r = 0.64. Students with more liberal orientations held more positive attitudes.
- Capitalist–socialist: r = 0.14. The report lists this as not statistically significant.
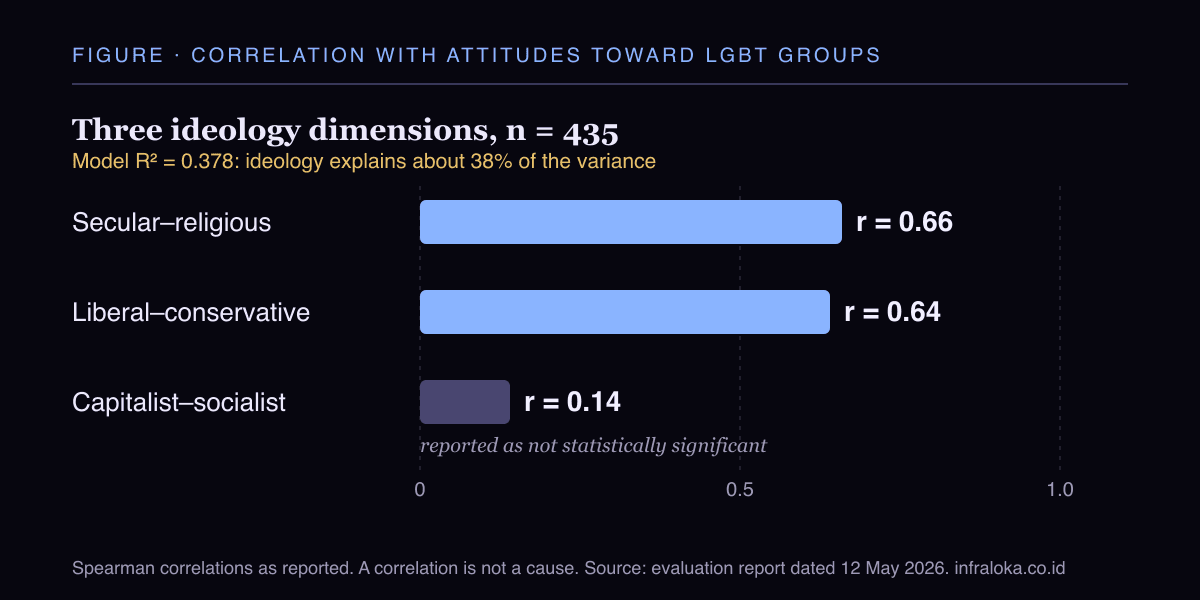
The report reads the secular–religious dimension as marginally stronger than the liberal–conservative one. With a gap of 0.02 I would treat the two as about equal. What stands out is the gap between those two and the economic dimension.
What the model explains
Taken together, the three dimensions account for 37.8% of the variance in attitudes. The other 62.2% comes from things outside the model, and the report is clear that ideology alone does not determine attitudes.
What respondents reported
- Roughly half (216 of 435) held positive attitudes toward LGBT groups.
- 68.2% recognised LGBT as a matter of sexual orientation.
- 64.2% did not blame LGBT individuals or society for the existence of LGBT people.
What the evaluation suggests
The evaluation report draws practical suggestions from the pattern: that education efforts on inclusion might focus on religious pluralism and on how religious faith and the inclusion of sexual minorities can coexist, which it sees as potentially more effective than abstract appeals to liberalism. That is the report's suggestion. The study did not test any intervention.
What these numbers do not show
- A correlation is not a cause. The study cannot say that being secular or liberal makes a student more accepting, or the reverse.
- The sample is one university's students, so the shares above are not national figures.
- The attitude scale has five items, so it summarises attitudes rather than describing them fully.
For the design behind these numbers see the survey method. For the plan to test them further see the proposed research agenda.
Corrections and contact
If Azzam Muhammadi Rizqun Karima, CAST-QUANTA or Universitas Indonesia would like anything here corrected or updated, including a link to the full study, please use the contact details on infraloka.co.id. If reliable evidence shows a factual statement in this series is wrong, I will correct it promptly and note the change.
Published by Rahmat Wibowo, InfraLoka — infraloka.co.id
#AzzamMuhammadiRizqunKarima #UniversitasIndonesia #PoliticalIdeology #ResearchSummary #LGBTAttitudes #CastQuanta